| 7 July 2020
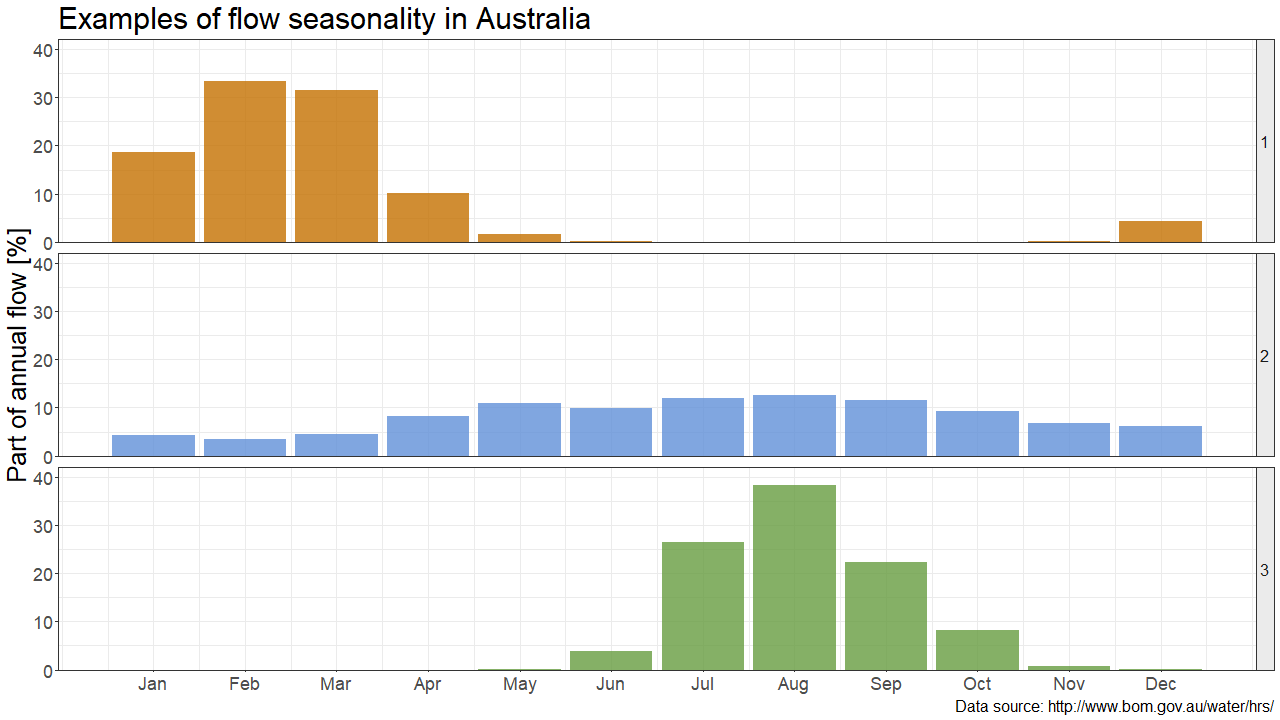
Investigating the hydrologic regime of 195 rivers in Australia revealed three types of flow seasonality. At some stations, the wettest period occurs during one particular season (winter or summer), whereas at others, similar flows are observed all year round.
How to determine the main seasonal and geographical patterns in hydrologic regimes more formally?
Splitting a dataset into groups
Any dataset can be split into groups using clustering methods. This post summarises the main steps of one particular method: hierarchical clustering.
Computing distances
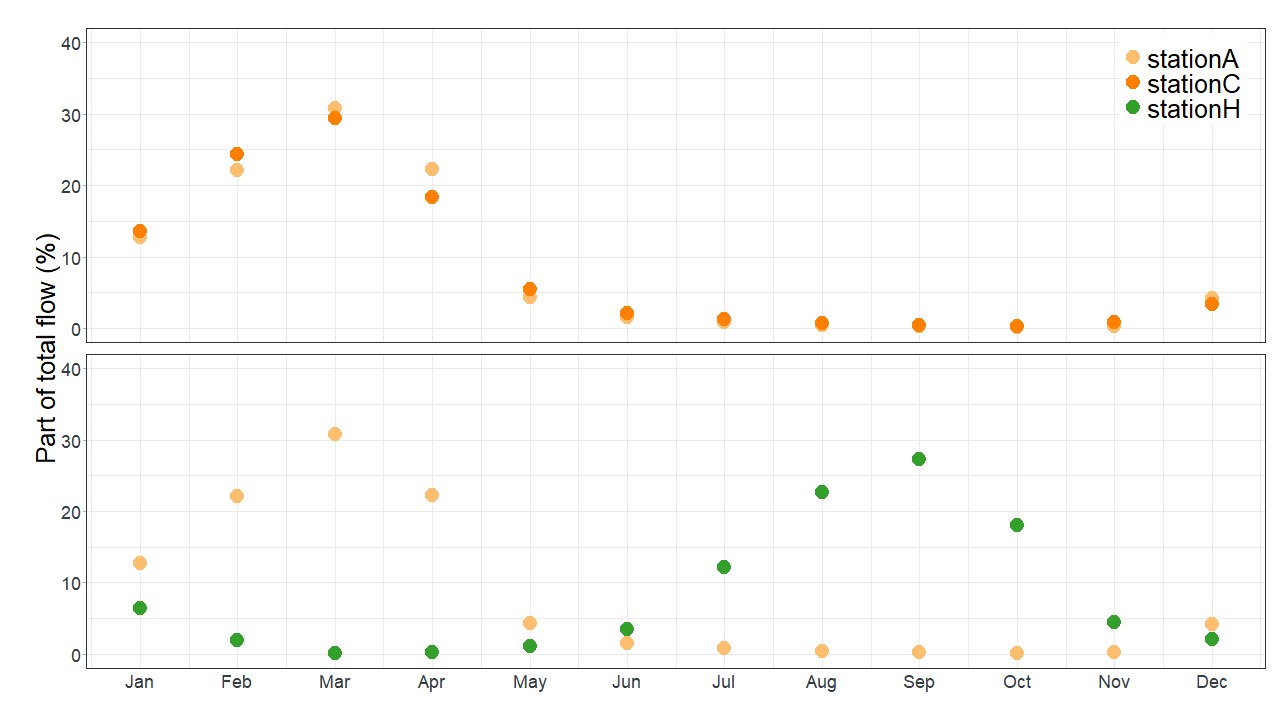
The first step is to compare the objects to be clustered two by two by defining a distance between them. Here, objects are streamflow stations and distances are calculated based on the fractions of the annual quantity of water flowing each month (in % of annual flow). The smaller the distance between two stations is, the more similar their flow distributions are.
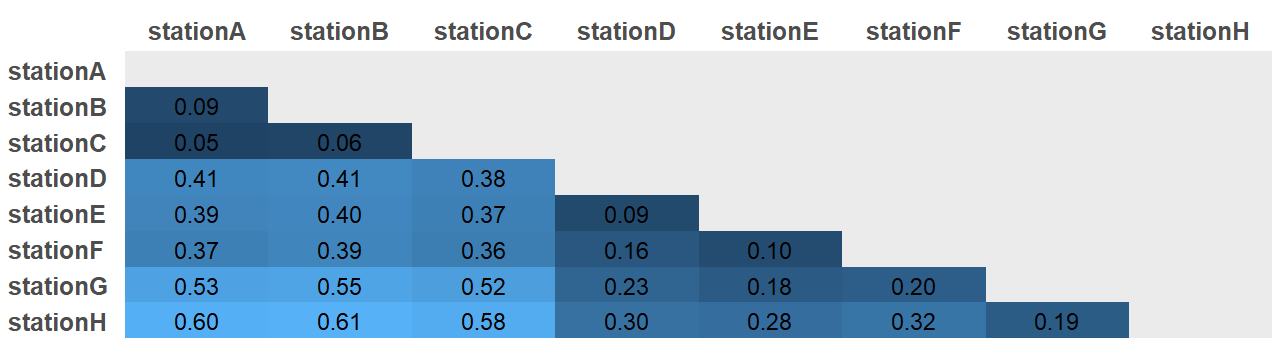
In the example below, station A is similar to station C as both stations display high flows during summer (distance = 0.05). On the contrary, station A is dissimilar to station H, as the later displays high flow during winter (distance = 0.60).
This first stage results in a table of distances like this:
Merging similar objects
The two closest stations in terms of flow distribution are then merged to form the first cluster C1. This step is reiterated using the remaining stations and C1 to form a second cluster C2, and so on. The difficulty is to compute distances when a cluster of stations is involved, as opposed to computing distances between individual stations (several clustering options exist).
| Merged objects | Cluster name | ||
|---|---|---|---|
| Step 1 | StationA | StationC | C1 |
| Step 2 | StationB | C1 | C2 |
| Step 3 | StationD | StationE | C3 |
| Step 4 | StationF | C3 | C4 |
| Step 5 | StationG | StationH | C5 |
| Step 6 | C4 | C5 | C6 |
| Step 7 | C2 | C6 | C7 |
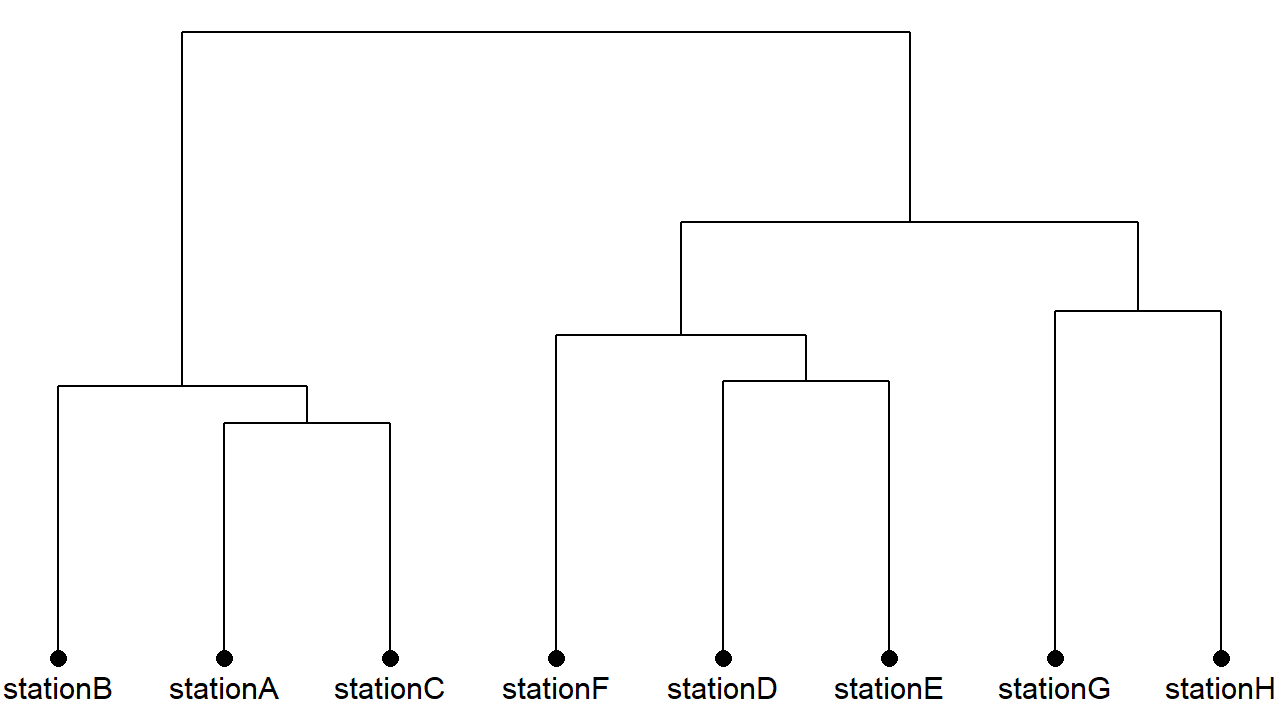
The result of this process can be visualised on a tree called dendrogram:
- the horizontal lines link the two closest clusters at each step;
- the vertical lines show when they are linked during the process: the taller the vertical line is, the later the two clusters are merged.
Gathering objects into groups
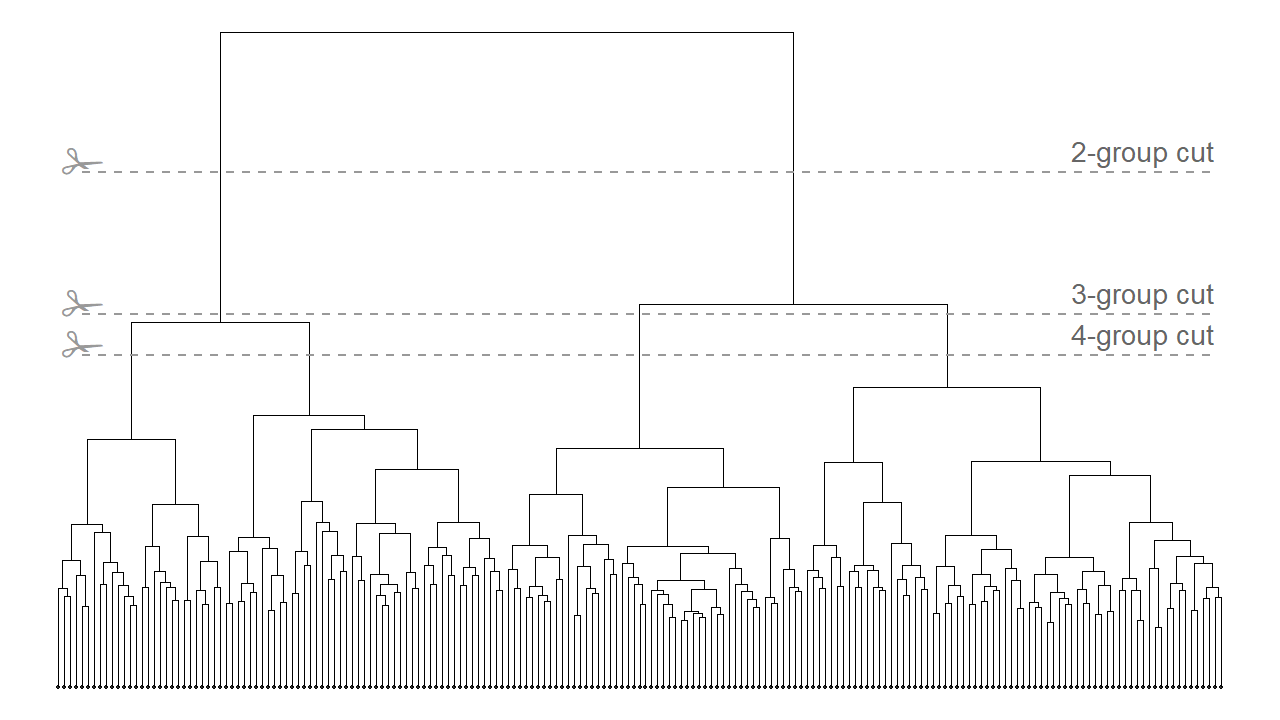
The final step is to cut the dendrogram to form a given number of groups so every single station belongs to a group. On the example below, the dendrogram is cut into three groups following the dotted line.
Australia’s main hydrologic regimes
The clustering process is performed on the Australian reference dataset provided by the Bureau of Meteorology, with daily runoff data at 195 stations. The dendrogram suggests that stations can clearly be split into either two or four groups but the originally suspected 3-group cut is less appropriate.
Now, the 195 stations are split into 1, 2, 3 or 4 groups and the hydrologic regime of each group is revealed in an animation. The point height (y-axis) on the left-hand side plot displays the fraction of annual quantity of water flowing during each month (in %). The point colour corresponds to one particular hydrologic regime, both on the plot and the map showing the station locations. All colours are picked from the ochRe palettes, which are inspired by Australian landscapes and artworks.
When the stations are split into two groups, the hydrologic regimes are well defined both spatially and seasonally: the high flows are observed during summer in the northern stations and during winter for the southern stations. These two main groups can each be split into two subgroups, which display a lower seasonality in hydrologic regimes with similar flows all year round.
Author: Chloe
Codes and data: browse on GitHub