techniques

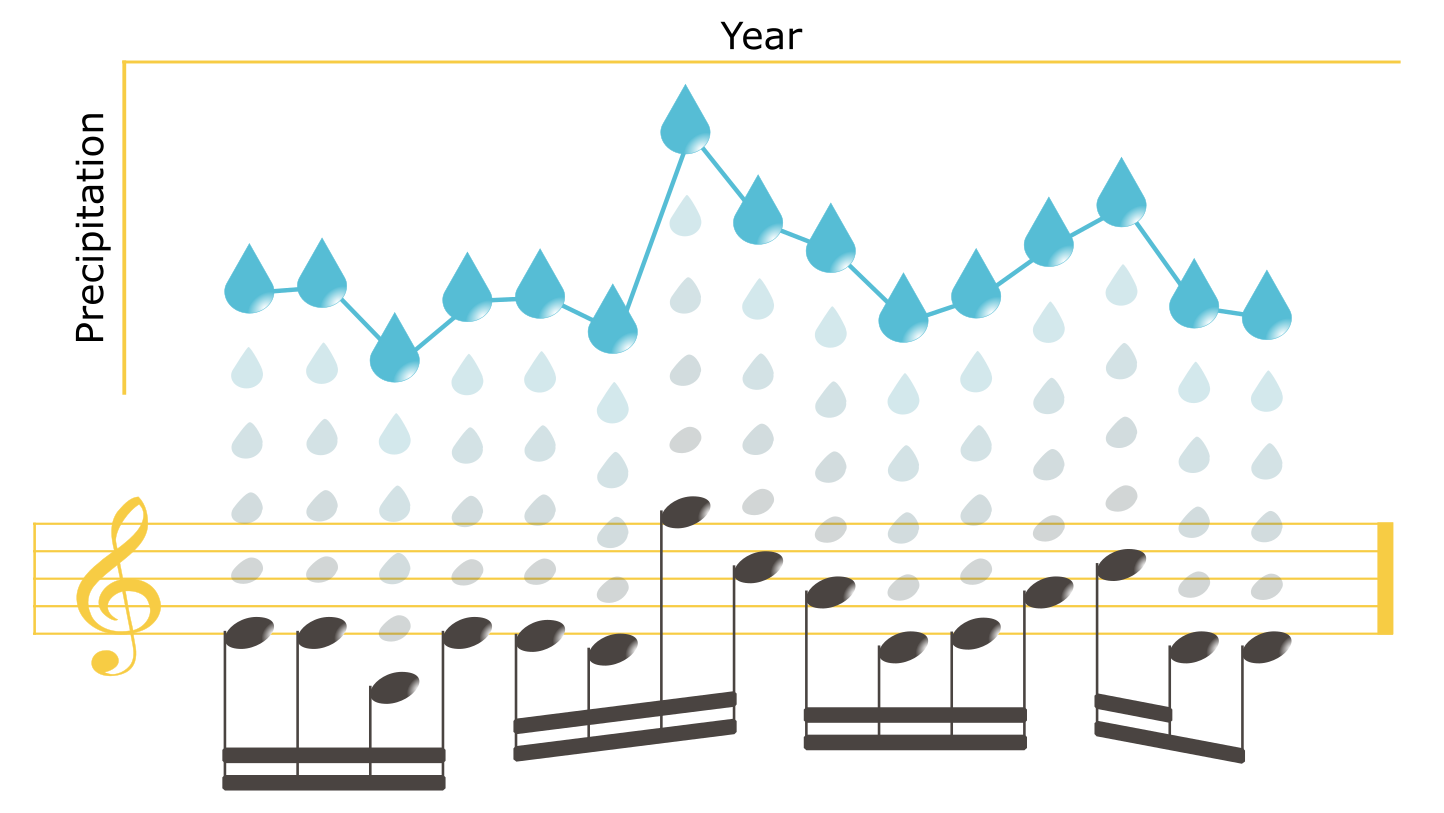
Sonification techniques: sequencing

Sounds triggered by events The map below shows the main flood events of 2019, their duration and the size of the flood-affected area (for further discussion of this dataset, see the post Sonification techniques: mapping data to pitch and volume).

Continue reading

Sonification techniques: mapping data to pitch and volume

Mapping data to visual or auditory properties A common visualization technique is to use the color or size of symbols to represent data. The bubble map below shows an example.

Continue reading

A short introduction to data sonification

What is data sonification? Sonification refers to the transformation of data into sound, using some algorithmic process. Here are three examples worth a thousand words:

Continue reading