Happy Birthday RECOVER !!!
RECOVER is the research unit I am working in, and it recently celebrated its tenth birthday. This provided an opportunity to illustrate its research activities by creating the RECOVER soundtrack.
RECOVER is the research unit I am working in, and it recently celebrated its tenth birthday. This provided an opportunity to illustrate its research activities by creating the RECOVER soundtrack.
In France, year 2022 witnessed severe drought conditions, leading to very low flows in rivers starting in the spring and widespread wildfire occurrences in summer.
Flood risk assessment relies on hydrometric stations (sometimes called streamgages) that monitor river discharge, i.e. the amount of water flowing in rivers every hour or day.
Observed data are essential to understand, quantify and predict the risk posed by extreme climatic events. In the case of floods or heavy precipitation, such data take the form of long series measured at stream gauging or weather stations.
The seasonality of flows in a river is an important part of its identity. Many studies start by displaying a chart similar to the one below to identify high-flow and low-flow seasons at a glance.
Avant de s’écouler dans la rivière, l’eau suit un long périple au sein de la surface de collecte des eaux appelée bassin versant (en rouge ci-dessous).
Some time ago we’ve been lucky enough to receive the postcard below from the Mc Murdo Dry Valleys, in Antarctica (thank you so much Kaelin!
In a previous post, we illustrated a widely used method called principal component analysis (PCA). This method can be used as an exploratory tool to summarise a dataset made of hundreds or thousands of time series into just a few ‘summary’ time series called principal components.
In hydrology, it is frequent to analyse long time series coming from many sites. The figure below shows monthly streamflows at 207 sites in France for the period 1969-2014.
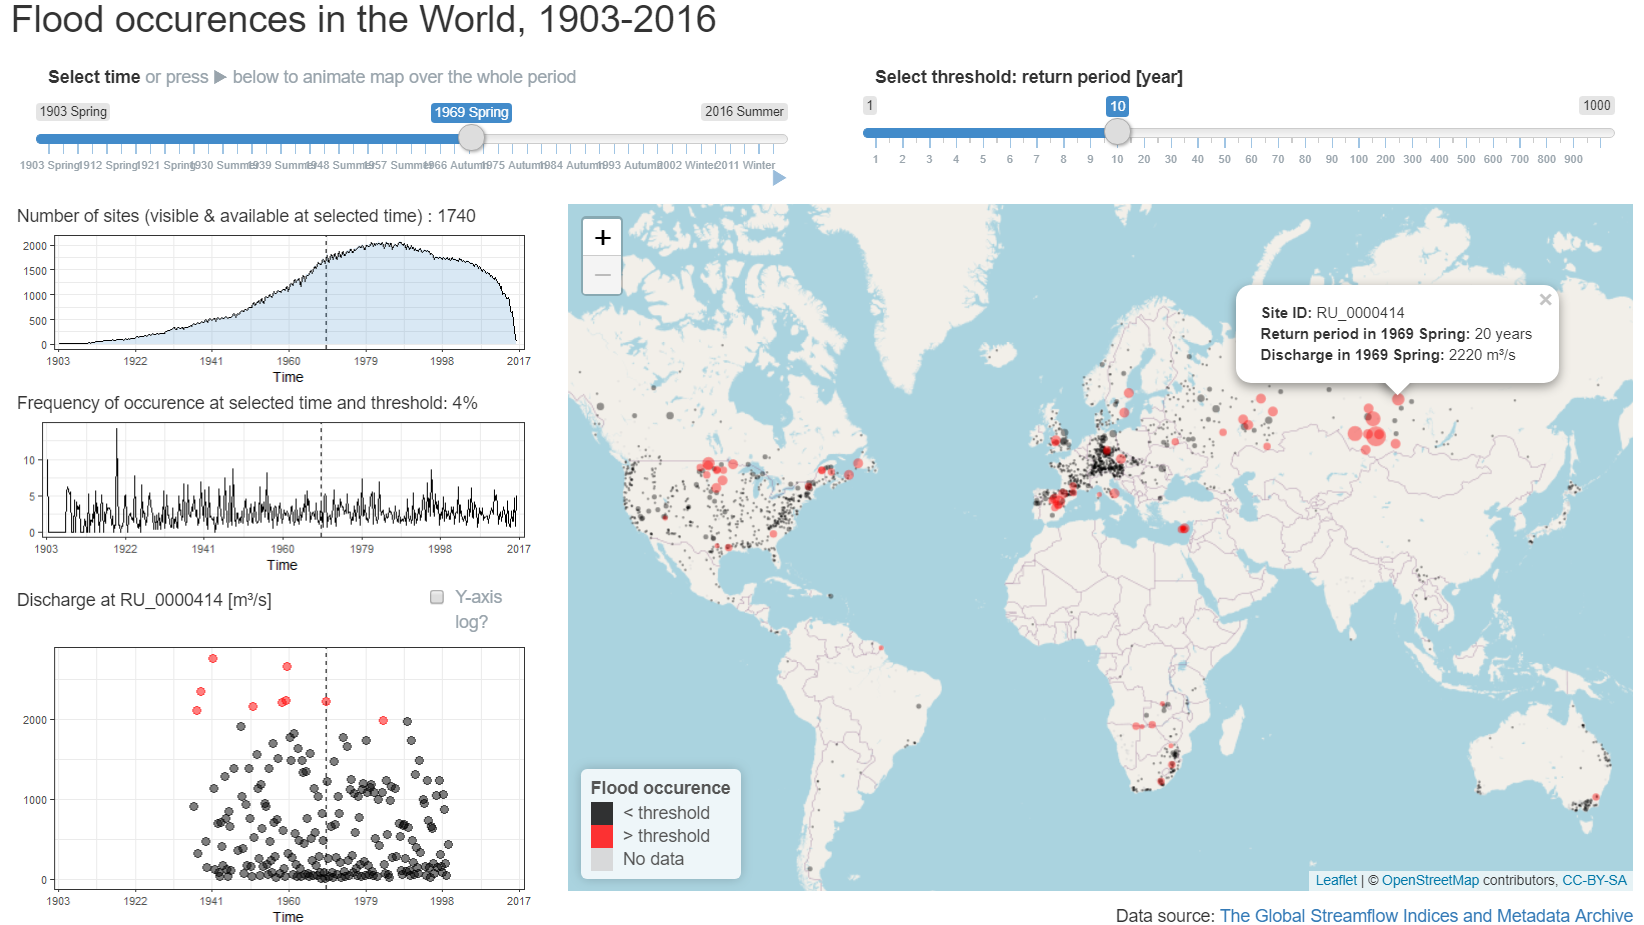
The Global Streamflow Indices and Metadata Archive describes hydrological regimes all over the World. A subset of around 2000 stations over the period 1903-2016 is used in the HEGS project to study floods at the global scale.
The map in the figure below shows the location of 195 hydrologic stations, which can be used to explore the hydrologic regimes of Australian rivers.
The Pacific Ocean sometimes catches a fever in its Eastern tropical part (off the coasts between Central America and Peru): for extended periods of time, its surface waters are abnormally warm.