| 29 October 2021
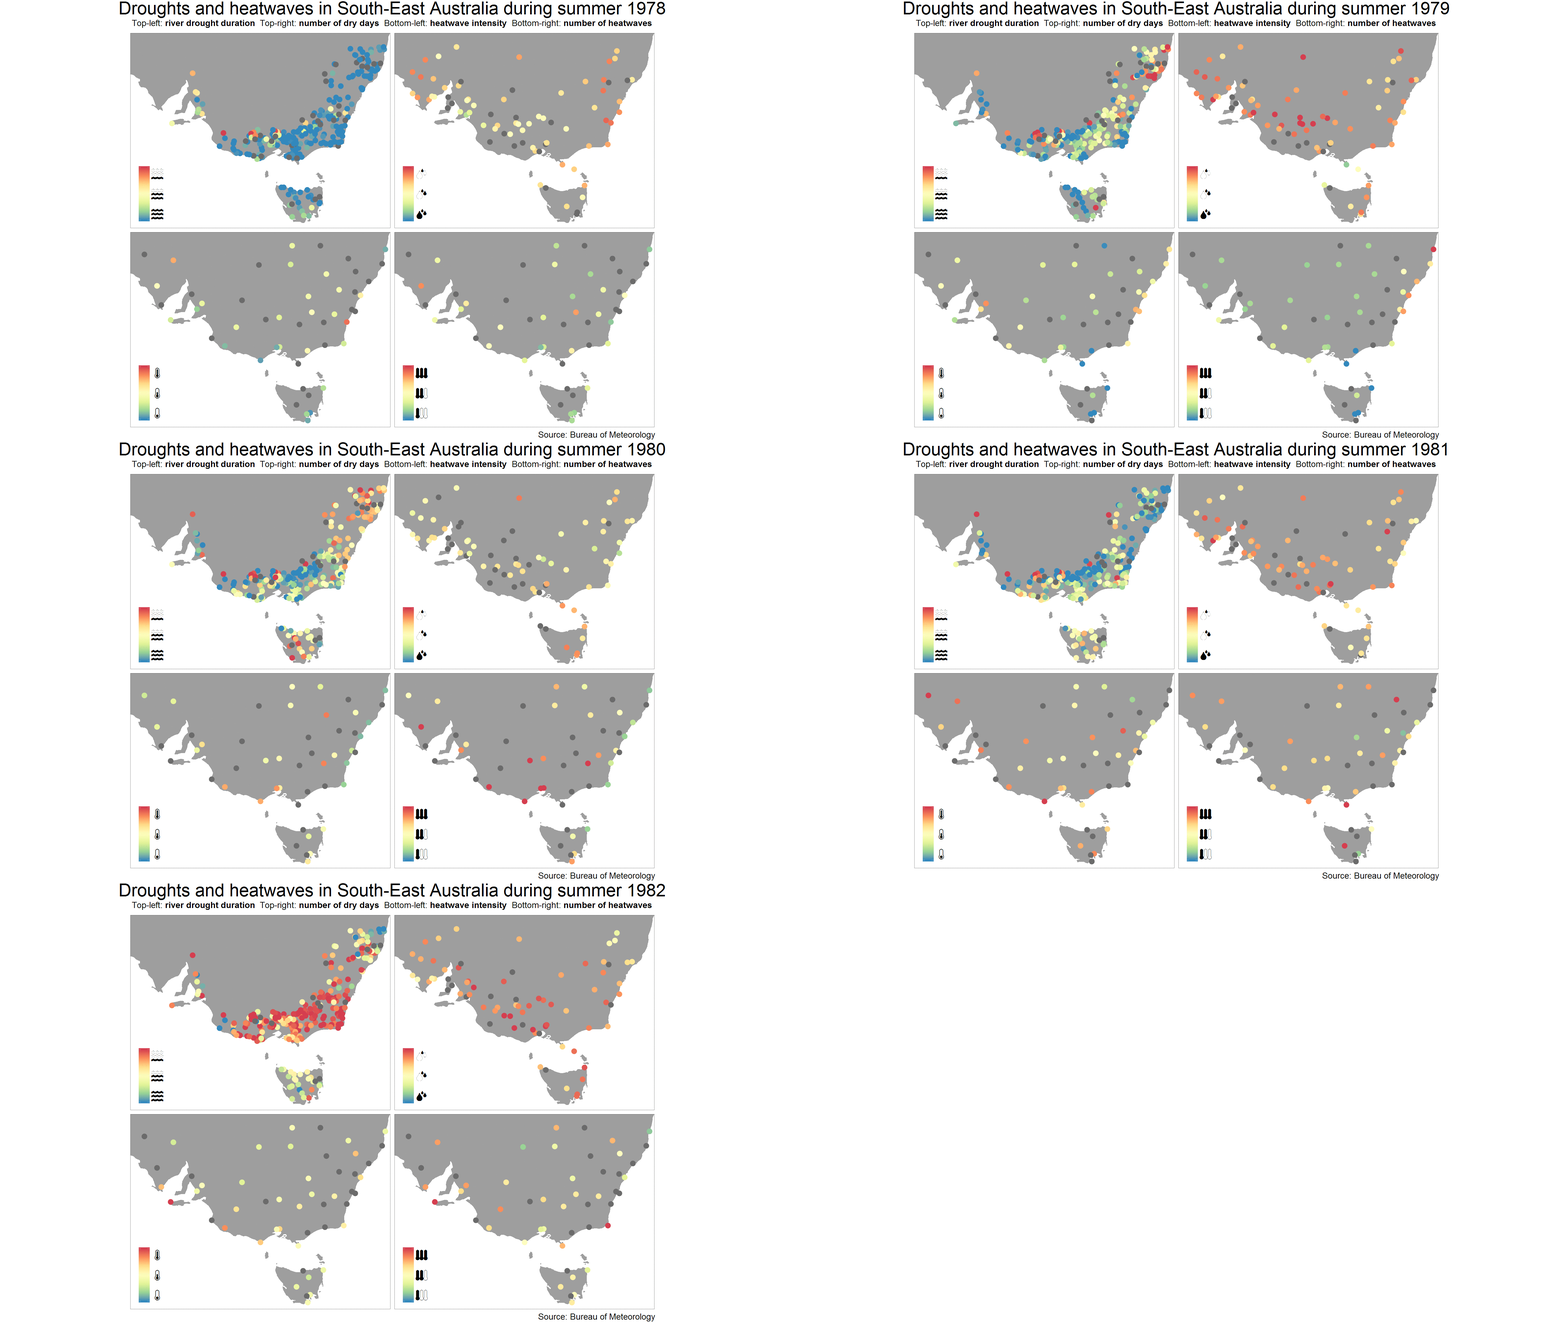
In a previous post, we illustrated a widely used method called principal component analysis (PCA). This method can be used as an exploratory tool to summarise a dataset made of hundreds or thousands of time series into just a few ‘summary’ time series called principal components. The dataset illustrated below aims at characterising ‘hot-and-dry’ summers in Southeast Australia and provides an example of such a large dataset: four variables representing river droughts, precipitation deficits and heatwaves are measured at many sites, yielding a total of 445 time series spanning 100 years (the animation only shows a short 5-year extract).

As part of the HEGS project, we developed a flexible statistical model that extends PCA in a way that allows computing the probability of extreme hot-and-dry events to occur across many sites and several variables (see this article for more details). Just as PCA, it is based on the identification of ‘summary’ time series named Hidden Climate Indices because they share similarity with the indices used to characterise climate phenomena such as the El Niño - La Niña oscillation.
Using both eyes and ears to explore the data
This type of method is also of interest to sonify a large dataset. Indeed, it would be challenging to create a nice-sounding piece by using each of the 445 time series above as a distinct musical instrument. However, using just a few hidden climate indices makes the task much more tractable. In the video below, the soundtrack was created using only three hidden climate indices that summarise the whole dataset shown in the animation. The technique of parameter mapping was used: the first hidden climate index controls the volume of the song; the second one controls the pitch of the guitar chords (inspired by a Leo Brouwer’s piece); the third one controls the pitch of the main melody. Note that the three hidden climate indices can be heard but cannot be seen in the video, which contrasts with previous sonification attempts where the target series could be both seen and heard. This is a conscious decision we made to try to take advantage of the complementary properties of eyes and ears.
This video highlights several key events and patterns in this dataset:
- The summer of 1982 (from December 1982 to February 1983) is very loud. It was part of a particularly severe drought event that culminated in the Ash Wednesday bushfires.
- The period 2002-2006 as a whole is also particularly loud, corresponding to the Millennium drought.
- Starting from 1999, the main melody is almost exclusively high-pitched, whereas low-pitched notes were used much more frequently at the beginning of the video. This can be interpreted as a warming melody.
Authors: Ben (sonification, writing) & Chloe (animation, writing)
Codes and data: browse on GitHub

