| 26 April 2020
What is data sonification?
Sonification refers to the transformation of data into sound, using some algorithmic process. Here are three examples worth a thousand words:
These videos illustrate three common sonification techniques we will explore in future posts of this blog:
- In the first earthquake video, the seismic signal is interpreted as a sound waveform and is just played; this technique is known as audification.
- In the second video, the temperature in one region is transformed into the pitch of the note played by one instrument; this is known as pitch mapping. This is a particular case of a more general approach known as parameter mapping, where data values can be mapped into some other attribute of the notes, for instance their volume or their duration.
- In the third video, a sound is played every time an asteroid impact occurs: this is known as sequencing a sound.
Those are only three possible ways to transform data into sounds, but many more have been developed over the years. Sonification is indeed not something new, as you can see from this short history. It even has its handbook! Check it out if you want to learn more about sonification techniques and principles.
Why sonification?
The videos above explore datasets in original and exciting ways, and the sonification process looks like a fun and interesting endeavor. These are already very good reasons to give it a try in my opinion! But there might be other advantages to be gained too, beyond the mere interest of the process.
Sound and image may carry different information
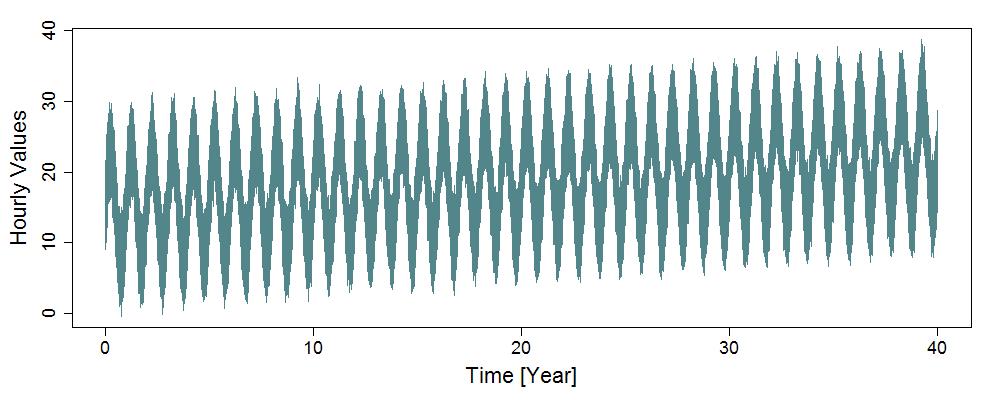
Data sonification may nicely complements data visualization. For instance, the figure below shows a standard plot of a time series containing 40 years of hourly data.
Look at the series …
This time series is now transformed into a 7-second sound by direct audification.
… then listen to it
For this particular time series, the properties that can be seen can’t be heard and those that can be heard can’t be seen:
- The plot highlights a strong annual seasonality and an apparent increasing trend. None of these properties can be heard. Some additional variability exists on top of that, but at this scale it just appears as some noisy scatter.
- The decreasing pitch of the sound corresponds to a decrease in the frequency of the ‘diurnal’ cycle (from 1 cycle every 24 hours to 1 every 29 hours); moreover, halfway through the sound, the noise is suddenly changing. None of these properties can be seen on the plot.
This example is admittedly a bit far-fetched because it was generated precisely to illustrate the points made above (the R code is here). Still, it illustrates the complementary strengths of eyes and ears: here, the former reveal the low-frequency properties of the series, the latter the high-frequency ones. Of course this does not imply that viewing high frequencies or hearing low frequencies is inherently impossible (it would just require some further processing), only that the two approaches reveal distinct properties when applied to the same raw time series.
Interest for multi-variable and/or spatial datasets
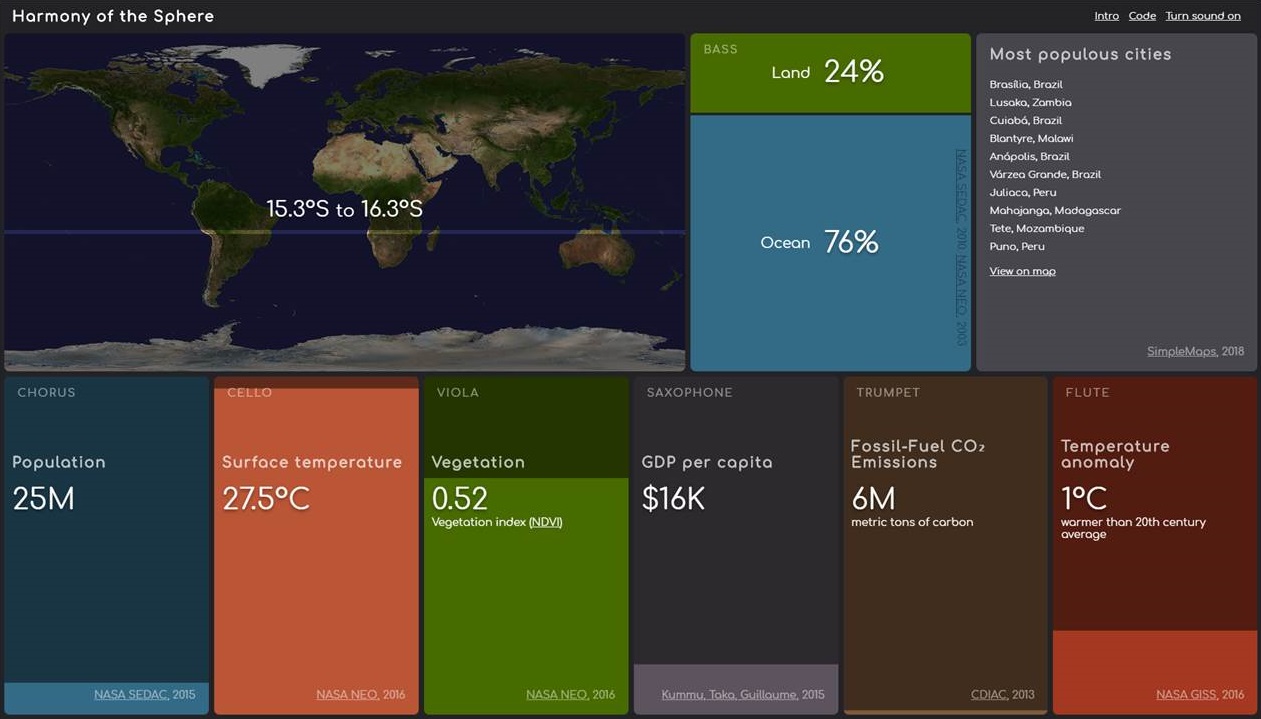
The ear is naturally capable of handling multiple sound sources. Sonification hence has potential to explore multi-variable and/or spatial datasets (for instance temperature + precipitation + streamflow at many locations), as illustrated by the string quartet video at the beginning of this post. Visualization can also be added on top of sonification to provide additional sensory channels to interpret multiple data. For instance, the image below, taken from Brian Foo’s Harmony of the Sphere, shows various physical and socio-economic variables at one particular latitude. A click on the image links to the original website, where one can not only hear these variables, but also interactively change the latitude and listen to the resulting sound change.
Making music
Finally, all the points above were considering sonification as a way to interpret data, but it is possible to reverse the perspective and to consider data as a way to create sounds and music. The example below is a composition by Markus J. Buehler using sounds generated from proteins. A sonification endeavor can hence be viewed as some sort of constrained composition exercise, with data providing the basic sounds, melody or rhythm that need to be further orchestrated to create a “nice-sounding” musical piece. It is arrangement rather than composition in a sense, the composer being the dataset itself! Transforming data not merely into sound but into music is a powerful way to add emotional content to the data.
Wrapping up
Sonification is in many ways similar to data visualization - it is very much visualizing with the ears rather than with the eyes. But while visualization is ubiquitous in any field making heavy use of data, and is even considered as an integral part of data analysis, sonification is still very incidental in comparison. Aren’t we missing something by just looking at the data, and not listening to it? One of the objective of this blog is to explore the potential of sonification in the context of hydroclimatic data, and in particular floods and extreme precipitations. We’ll start by applying basic techniques to simple datasets before progressively moving towards more complex cases, reporting on both failures and successes along the way.
Going further
While we are just at the beginning of the road in this blog, others have already achieved awesome outcomes. Here are a few examples:
- The works by Brian Foo, including a full album Data-Driven DJ and more interactive experiences such as Music Eclipticalis.
- Alexander Chen’s string instrument based on the New-York City subway.
- “Space sounds” on NASA’s and ESA’s soundclouds.
- Still with space data, the many projects of SYSTEM Sounds.
- Markus J. Buehler’s materiomusic.
- Threshold, a sonification of climate data by Nelson Guda.
- Earth System Model Music by Lee de Mora.
Going even further
And what about our other senses? After all we have five, so why not touchify, odorify or tastify data as well? Imagine for instance how Boris Vian’s Pianocoktail could be used to transform data into aromatic and tasty drinks. But we won’t go into this in this blog, it’s a bit difficult to convey touch, smell and taste through a computer (well, at the time of writing of this post at least… who knows what future computers and smartphones have in store for us!).
Author: Ben
Codes and data: browse on GitHub