| 10 December 2020
How does water end up flowing in rivers? As schematized below, it is the result of processes that have taken place in the river basin, also known as a catchment and delineated by a red line in the figure.
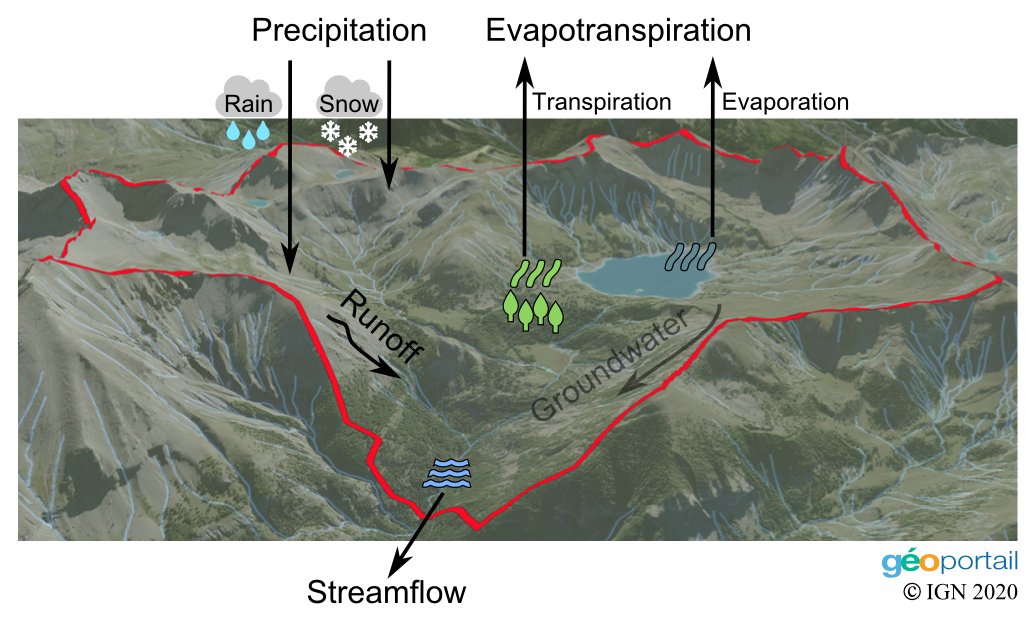
For a given river section, streamflow originates from precipitation that fell into the corresponding catchment. Snow stays where it lands until temperature is warm enough to melt it. From there, water originating from either melted snow or rain moves downward to the river through many possible paths. For instance, it may infiltrate the soil and take a slow underground trip. Alternatively, it may quickly run off a rocky or soaked surface. Part of this water never makes it to the river, and goes back to the atmosphere by evaporation (from the soil or from a lake for instance) and transpiration (from the vegetation). The sum of the two processes is called evapotranspiration.
Sounds from the catchment
In summary, there is basically one way in (precipitation) and two ways out (streamflow and evapotranspiration) of the catchment. This post explores the daily time series corresponding to these three key variables for the Ardèche river at Sauze (France, catchment area: 2258 km²).
The sonified animation below uses the technique of parameter mapping:
- Precipitation controls the rhythm section (vibraphone, drum kick and bass).
- Streamflow controls an electric guitar. It is expressed in millimeters (mm) to make comparisons with precipitation easier. The value in mm can be interpreted as the thickness of the layer that would result from collecting all the daily streamflow and spreading it evenly across the whole catchment.
- Potential evapotranspiration controls an electric piano. It is also expressed in mm, with the same interpretation as for streamflow.
Weeks are highlighted using 7-note patterns that can be heard during the introduction. The 10-second introduction corresponds to 8 weeks of data.
Precipitation and streamflow look similar but the latter is roughly twice as small and looks a little smoother. This is often referred to as the filtering role of the catchment when transforming precipitation into streamflow. The guitar always seems to be late with respect to the bass and the vibraphone, reflecting the time needed for precipitation to induce a streamflow response.
Potential evapotranspiration, on the other hand, looks totally different from precipitation and streamflow: the values are much smaller (only a couple of mm at most), but they are less erratically distributed during the year. As suggested by the piano, it is the dominant process during the summer months but it becomes less prominent during winter.
The tricky water balance in a catchment
In the long term, the amount of water entering and exiting the catchment should add up. Keeping track of this is called studying the catchment water balance.
Unfortunately, streamflow, precipitation and evapotranspiration are not always sufficient for this purpose, because catchments are not perfectly closed systems as implied by the simplified description above. In particular, water can be exchanged between catchments. Such a transfer of water may be generated artificially as part of a water management strategy, but it may also occur naturally due to some underground geological feature resulting in one catchment leaking into another.
In addition, none of the three times series in the animation are direct measurements, which induces all sorts of uncertainties:
- The precipitation time series corresponds to the average precipitation over the whole catchment. It is estimated using a relatively small number of raingauges which represent a very small fraction of the catchment area.
- The streamflow time series is estimated from the measurement of the water height in the river. This transformation is not straightforward.
- The potential evapotranspiration time series is not an estimation of evapotranspiration itself, but rather an estimation of its maximum possible value: it is the amount of water that would be returned to the atmosphere if this water was available in soil, plants, lakes, etc. But the actual evapotranspiration might be much lower than the potential one if there is no much water left at the surface to be evaporated.
Studying the catchment water balance without precisely measuring what comes in and what goes out makes it both challenging and interesting!
Authors: Ben (figure, sonification, writing) & Chloe (animation)
Codes and data: browse on GitHub