
| 1 February 2024
Flood risk assessment relies on hydrometric stations (sometimes called streamgages) that monitor river discharge, i.e. the amount of water flowing in rivers every hour or day. In France, many hydrometric stations were installed during the 1960’s , progressively building into a large national hydrometric network. However, very few stations existed before the 1950’s. The situation is similar in many countries around the world, as shown in the figure below.
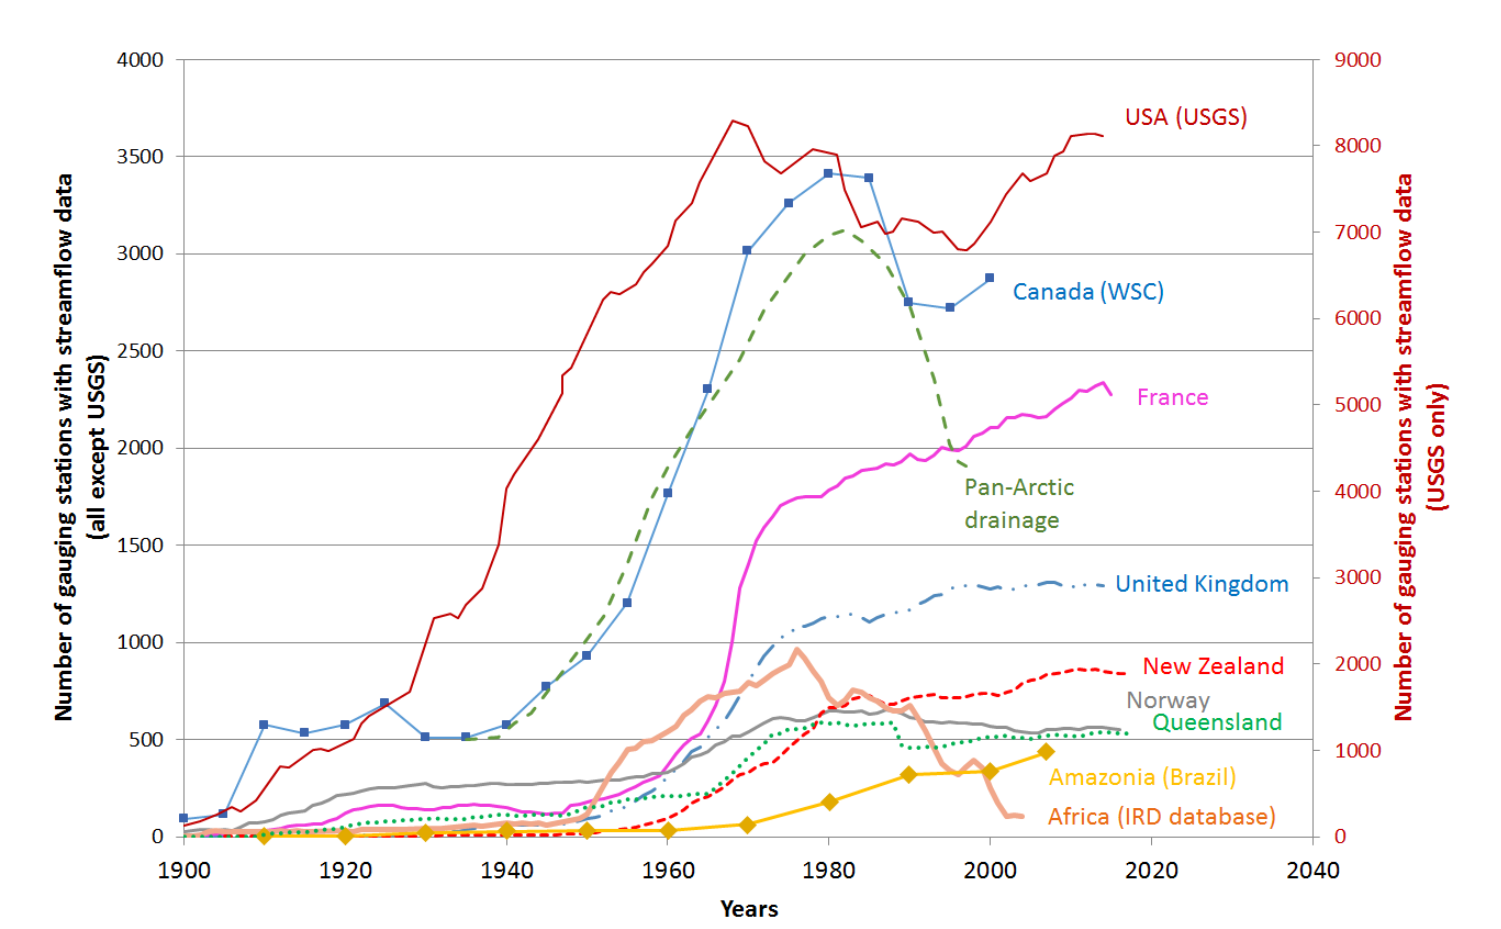
Number of operative hydrometric stations over the years in various countries. Source: Le Coz, 2017.
Obviously, floods didn’t wait for hydrometric stations to occur. What other sources of information can we use to travel back in time before the mid-20th century and estimate the major flood events that occurred in the last few centuries?
In France, the flood mark database is one such source of information. It describes thousands of geolocalized, perennial flood marks such as plaques or markers painted or carved on walls, sometimes dating back several centuries. This information can be used together with data from hydrometric stations to estimate ancient flood probabilities in France. This blog post aims at illustrating the process used for this reconstruction, with full details available in this article.
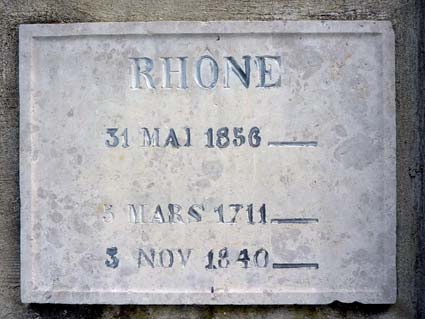
Example of flood marks. Source: reperes de crues, SPC Grand Delta.
The reconstruction of ancient flood events is based of the method of hidden climate indices, which was already described in a previous post. The video shown below illustrates the underlying principle. The starting point is the dataset shown in the two small maps of France (top right quadrant). On the left, points represent “active” flood mark sites, i.e. sites for which the earliest and the latest flood marks bracket the current year. An orange point denotes the presence of a flood mark. On the right, points represent active hydrometric stations, and the size and “orangeness” of the point is proportional to the discharge measured for the largest flood of the year.
The time series below those maps show two hidden climate indices that have been identified from these data: they can be thought as “invisible hands” that drive the occurrence of both flood marks at sites and large discharge values at hydrometric stations. At the beginning of the video, the large number of available hydrometric stations leads to a precise identification (i.e. with a small uncertainty) of the hidden climate indices. As one moves back in time, the number of available stations decreases, which leads to an increase in uncertainty. However, thanks to the flood marks, it remains possible to identify - albeit unprecisely - the hidden climate indices, even when there is not a single hydrometric station left. Finally, the hidden climate indices can be used to compute flood probabilities at hydrometric stations (large map on the left), during the whole period 1705-2015 - that is, before the hydrometric stations even existed!
The music in the video has been created by applying the sonification technique of parameter mapping to the two hidden climate indices: they control the pitch and volume of two electric pianos, which you can hear in the left and right ear if you’re using headphones. The amount of reverberation is also increasing with the uncertainty as one moves back in time.
This video highlights some large flood events that have left a trace in the collective memory of the country and have shaped many national strategies for flood risk management: the 1910 flood of the Seine river, that strongly impacted Paris; the multiple events during the mid-19th century, in particular on the Loire river; or, more than 300 years ago, the floods of February-March 1711 that affected most large rivers in France including the Loire, the Seine, the Rhône and the Saône.
Author: Ben
Codes and data: browse on GitHub