El NiñOz
The Pacific Ocean sometimes catches a fever in its Eastern tropical part (off the coasts between Central America and Peru): for extended periods of time, its surface waters are abnormally warm.
The Pacific Ocean sometimes catches a fever in its Eastern tropical part (off the coasts between Central America and Peru): for extended periods of time, its surface waters are abnormally warm.
Sounds triggered by events The map below shows the main flood events of 2019, their duration and the size of the flood-affected area (for further discussion of this dataset, see the post Sonification techniques: mapping data to pitch and volume).
Plotting hydrologic regimes Most hydrologic studies start by determining the average quantity of water in rivers and how it is distributed throughout the year.
Mapping data to visual or auditory properties A common visualization technique is to use the color or size of symbols to represent data. The bubble map below shows an example.
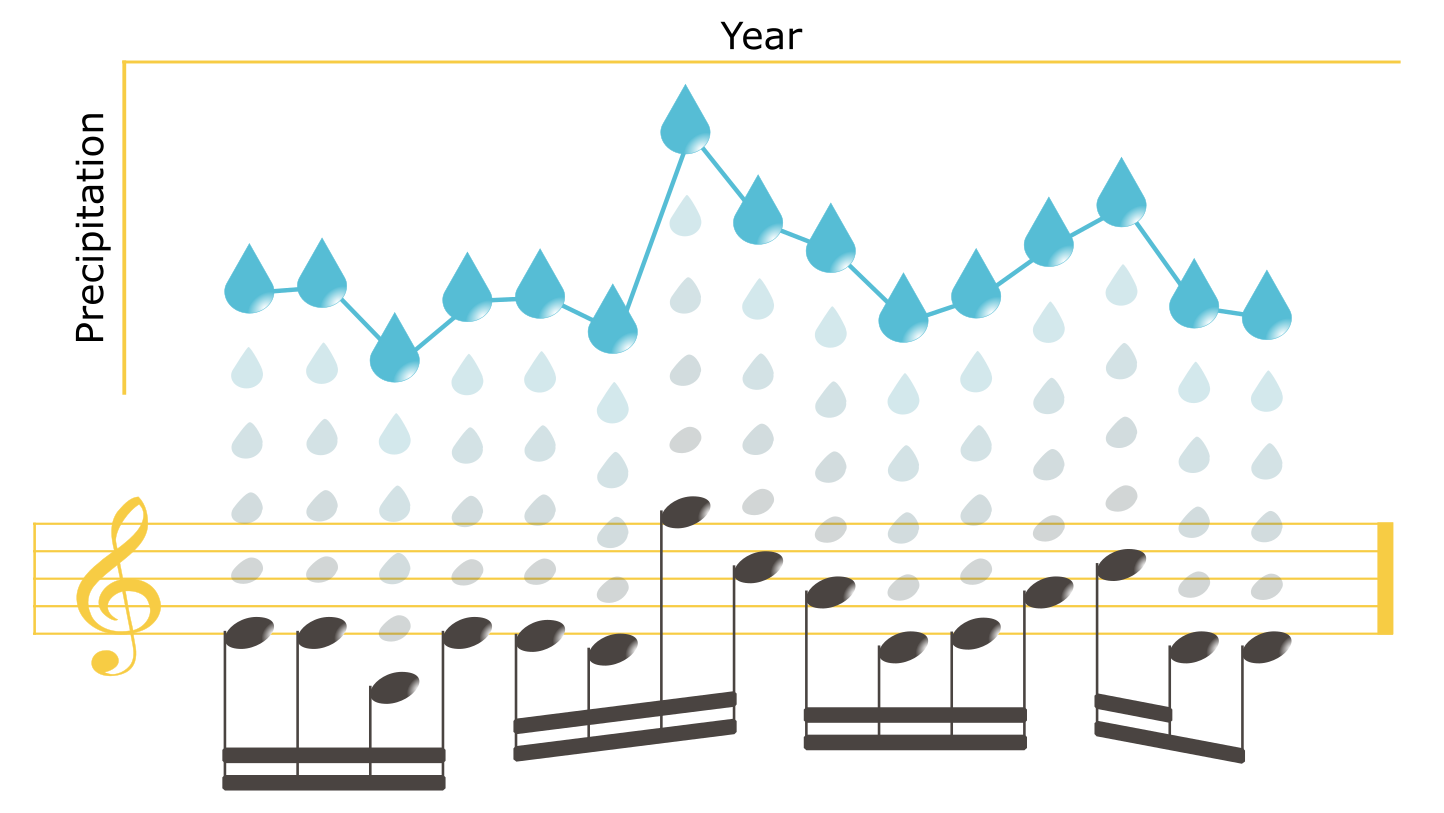
What is data sonification? Sonification refers to the transformation of data into sound, using some algorithmic process. Here are three examples worth a thousand words: